Build Savings
The more money you save and the earlier you begin saving, the more your money will grow. It’s important to make saving a priority now, even if money is tight.
- Make savings automatic. If you want to break the paycheck-to-paycheck cycle and experience financial freedom, make saving a habit. Each pay period, automatically transfer money from your paycheck to your savings account. Direct deposit makes saving simple, because you’re less likely to spend what you don’t see.
- Adjust your withholdings. If you’re employed, make sure your W-4 form is filled out to your best advantage. File a new W-4 anytime there’s a major change in your life, like a marriage, birth of a child or purchase of a home, all of which can affect the amount of tax you’ll owe. Learn about completing a W-4 form.
- Cut corners. If you save $20 per week by bringing your lunch to work, put that money into savings. If you frequently spend money on movies, see a matinee or subscribe to a monthly online streaming service and deposit the difference in your savings account.
- Reduce monthly fees. Monthly fees can add up to hundreds of dollars per year. Eliminate services that you pay for but don’t use, like, gym memberships and premium cable channels.
- Put away windfall money. If you earn a raise, get a refund or receive a cash gift, put it into savings. Maximizing “found” money will help you reach your goals faster.
- Pay yourself. If you’re currently making debt payments, when you’ve paid the balance in full, use that money to make regular contributions to your savings account.
- Keep your eyes on the prize. Whether your goal is next semester’s tuition, home ownership or early retirement, regularly remind yourself why you’re saving. Motivate yourself by posting notes or saving pictures on your phone that represent your goals where you’ll see them often.
- Invest today for wealth tomorrow. Once you’ve established an emergency fund, eliminated debt and have some short-term savings in place, start thinking about long-term investing. If your employer offers a 401(k) or other pretax matched savings plan, aim to invest at least as much as your employer will match. If you don’t, you’ll lose free money!
It All Adds Up
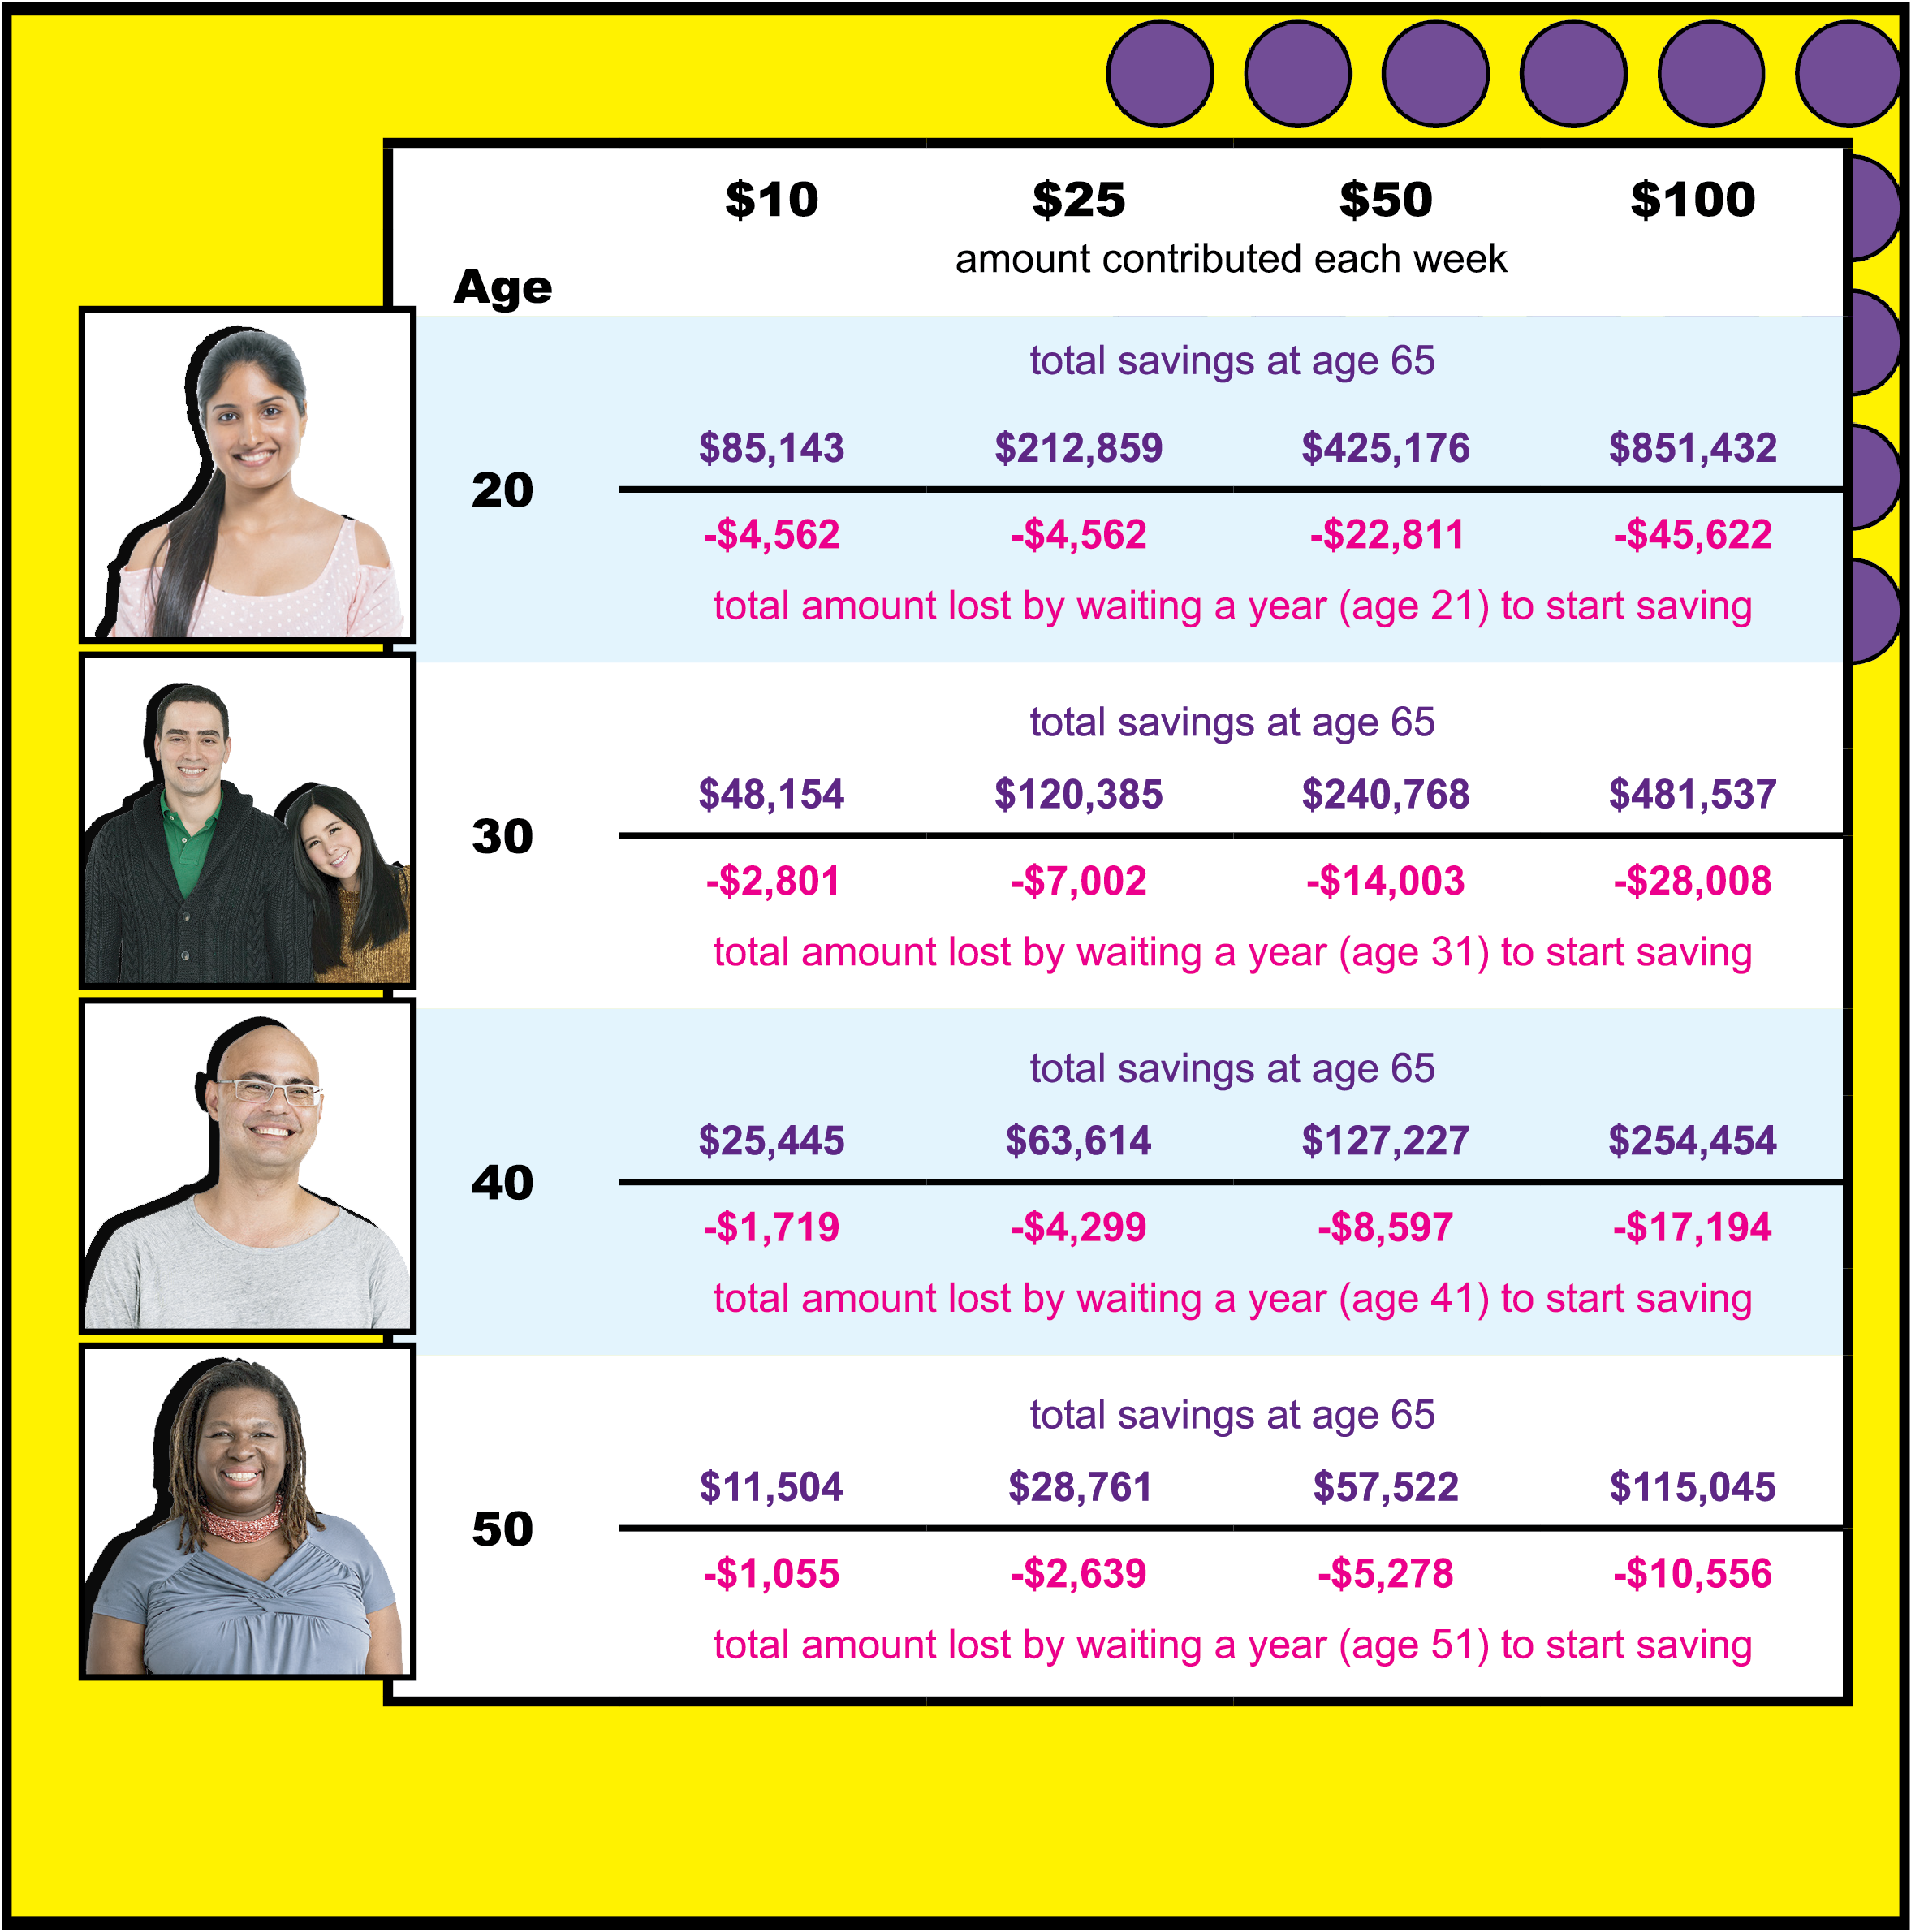
::Savings Chart::The more money you save and the earlier you begin saving, the more your money will grow. Look at how much you can have by age 65, depending on the age you begin saving and the amount saved weekly. On the flip side, check out how much you’ll lose if you wait just one year to start saving. This chart assumes a 5% return, compounded annually.
|
|---|
More Savings Strategies
- Make it automatic. Each pay period, have money automatically transferred from your paycheck to your savings account. Direct deposit makes saving simple because you won’t miss what you don’t see.
- Adjust withholdings. Make sure your W-4 form is filled out to your best advantage. Submit a new W-4 anytime you experience a major life change, like a marriage or birth of a child, which can affect the amount of tax you’ll owe. If you receive a sizable tax refund each year, consider adjusting your withholdings so you can retain more of your income each month. Instead of giving Uncle Sam an interest-free loan, put that money in savings so it can benefit you.
- Put away windfalls. When you earn a raise, receive a refund or cash gift, save it. You can get by without the extra money, so put it toward your saving goals.
- Ask for a discount. Whether you’re buying a gym membership, hotel stay, car insurance or beauty treatment, ask for a discount. Asking doesn’t hurt and you never know—they may just grant your request.
- Re-evaluate service providers. Routinely compare auto and home insurance providers to make sure you’re getting the best rate. You may receive a significant discount if you bundle policies with the same company. Also, some providers offer discounts if you work for specific employers or within a particular industry.

![]()